Grafana + GarminDB: Part 1
493 words, est. 2 minI stumbled upon GarminDB a while ago, and as we are doing more and more DevOps at work I feel the need to learn more about how to monitor (micro) services, specifically using Grafana as that is what we are using at work.
It hit me that combining GarminDB with Grafana to visualise my fitness data would be a nice little project to learn some Grafana.
Precondition
I have downloaded my Garmin data in order to have some data to work with. Checkout GarminDB to download your own dataset.
Setup Grafana
I am running Grafana at port 3310 since I have another service running at 3000. Its storage is persisted next to the docker-compose.yml file.
Since I want to visualize my health data from Garmin, I mount the directory where I have the SQLite databases too.
The user and group 1000:1000 is the user and group of the directory where the SQLite databases are stored, and should be the same as the owner of the mounted HealthData directory.
services:
  grafana:
    image: grafana/grafana-oss
    container_name: grafana
    restart: unless-stopped
    user: '1000:1000'
    volumes:
      - ./grafana-storage:/var/lib/grafana
      - ./HealthData:/opt/HealthData
    ports:
     - '3310:3000'
Setup Data Sources
SQLite
There is a community plugin for making adding SQLite as data source, you find it here (adjust to your own IP-address): http://10.1.1.100:3310/plugins/frser-sqlite-datasource.
Once installed, go to Connections -> Data sources and press + Add new data source. Give it a name (garmin.db) and set the Path to /opt/HealthData/DBs/gamin.db. Leave the other options as-is and click Save & test.
Again – the HealthData directory next to docker-compose.yml must have the same owner user and group as Grafana.
First Dashboard
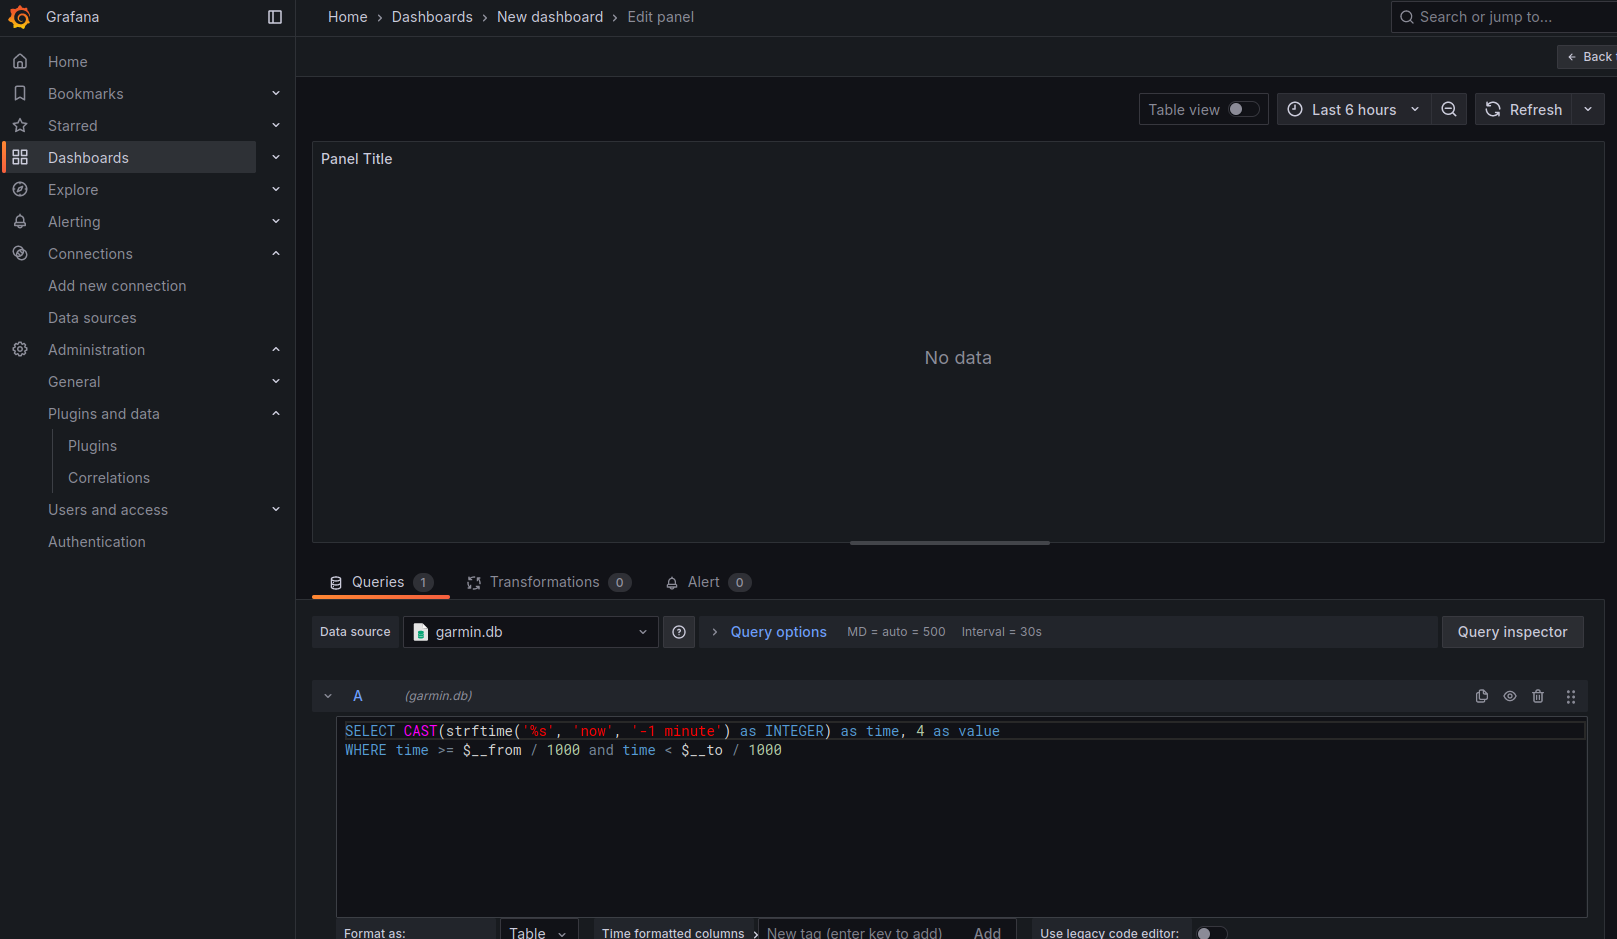
Go to Dashboard in the left menu, then + Create dashboard, then + Add visualization. Pick garmin.db in the list of available data sources.
WITH converted AS (
   -- a row looks like this (value, date): 1.45, '2020-12-12'
   SELECT resting_heart_rate, day || 'T00:00:00Z' AS datetime FROM resting_hr
)
Grafana requires the time axis to be formatted as unix timestamps or in accordance with RFC3339. Therefore you need to convert the day column to RFC3339 compatible dates by adding the snippet above.
The final query ends up like this:
WITH converted AS (
   -- a row looks like this (value, date): 1.45, '2020-12-12'
   SELECT resting_heart_rate, day || 'T00:00:00Z' AS datetime FROM resting_hr
)
SELECT resting_heart_rate, datetime FROM converted ORDER BY datetime ASC
You should now see a nice dashboard of your resting heart rate. Unfortunately, my data is kind of crap – at least the older measurements.
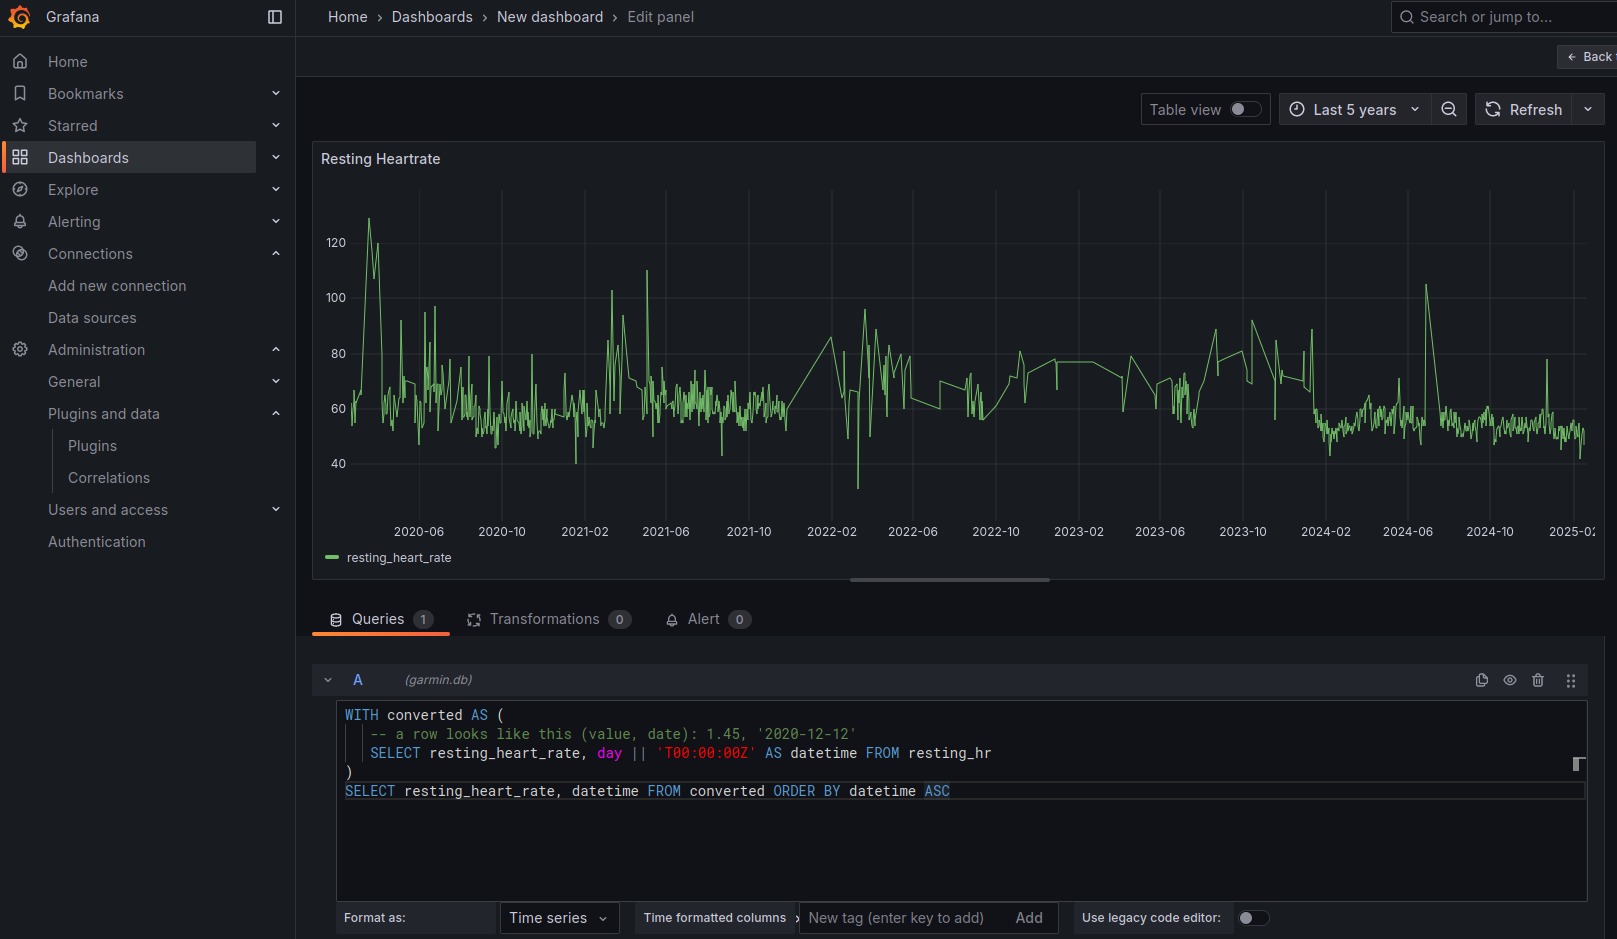
Adding new visualizations to the dashboard is as easy as cloning the existing visualization and changing the query. Use a database viewer to see the tables and columns in the database, so see which data you have available.
While browsing Grafana and its datasource providers, I noticed that there is a plugin for Strava. That will be a good complement to the Garmin data, as I have been using Strava for longer than I have had a Garmin device.